Visualización del Olivetti Faces dataset — 5:57 min
5:57 min | Ultima modificación: Septiembre 28, 2021 | YouTube
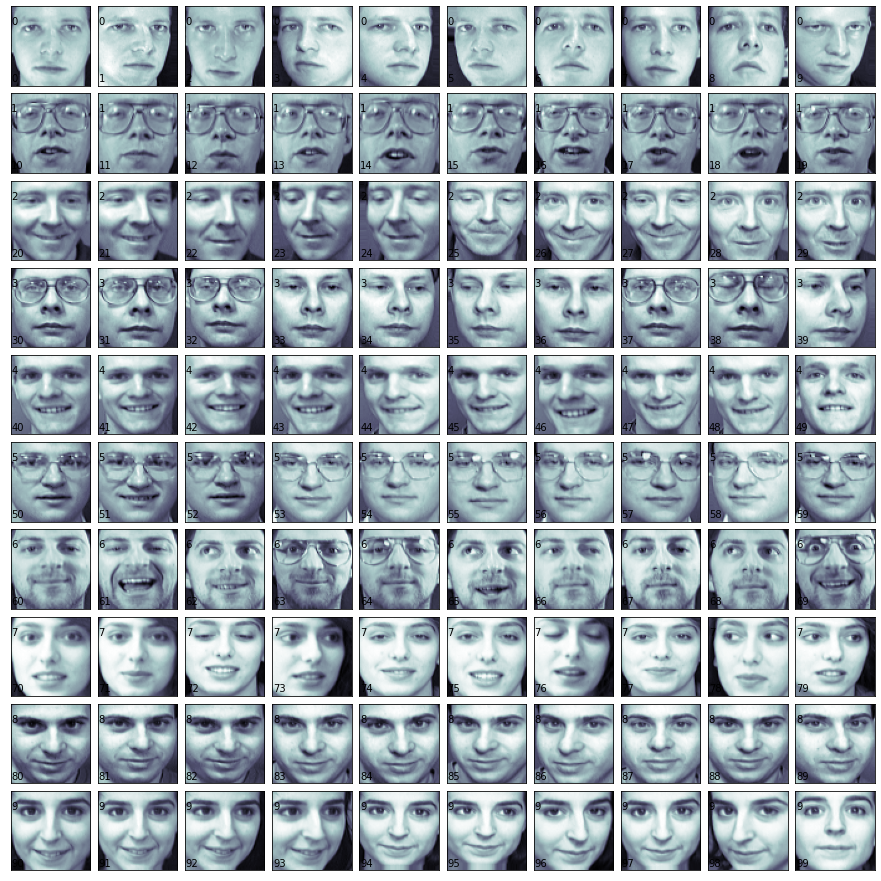
Matplotlib puede ser utilizado para la visualización de imágenes que están codificadas en niveles de gris. En este ejemplo, se ilustra como visualizar una matriz de imágenes de un dataset comunmente utilizado en machine learning.
[1]:
import matplotlib.pyplot as plt
from sklearn.datasets import fetch_olivetti_faces


def print_faces(images, target, top_n):

    fig = plt.figure(figsize=(12, 12))

    fig.subplots_adjust(
        # ---------------------------------------------------------------------
        # Adjust the subplot layout parameters.
        # ---------------------------------------------------------------------
        # The position of the left edge of the subplots, as a fraction of the
        # figure width.
        left=0,
        # ---------------------------------------------------------------------
        # The position of the right edge of the subplots, as a fraction of the
        # figure width.
        right=1,
        # ---------------------------------------------------------------------
        # The position of the bottom edge of the subplots, as a fraction of the
        # figure height.
        bottom=0,
        # ---------------------------------------------------------------------
        # The position of the top edge of the subplots, as a fraction of the
        # figure height.
        top=1,
        # ---------------------------------------------------------------------
        # The height of the padding between subplots, as a fraction of the
        # average Axes height.
        hspace=0.1,
        # ---------------------------------------------------------------------
        # The width of the padding between subplots, as a fraction of the
        # average Axes width.
        wspace=0.1,
    )

    for i in range(top_n):

        p = fig.add_subplot(
            # -----------------------------------------------------------------
            # Tamaño de la malla de figuras
            10,
            10,
            # -----------------------------------------------------------------
            # Figura seleccionada
            i + 1,
            # -----------------------------------------------------------------
            # marcadores de los ejes
            xticks=[],
            yticks=[],
        )

        p.imshow(
            # -----------------------------------------------------------------
            # Display data as an image, i.e., on a 2D regular raster.
            # -----------------------------------------------------------------
            # Datos de la imagen
            X=images[i],
            # -----------------------------------------------------------------
            # colormap
            cmap=plt.cm.bone,
        )

        # imprime el número del individuo
        p.text(0, 14, str(target[i]))

        # imprime el número de la imágen
        p.text(0, 60, str(i))
[2]:
bunch = fetch_olivetti_faces()

bunch.images.shape
[2]:
(400, 64, 64)
[3]:
print_faces(
    bunch.images,
    bunch.target,
    100,
)
