Tutorial básico de pyplot — 17:33 min
17:33 min | Última modificación: Octubre 6, 2021 | YouTube
[1]:
import matplotlib.pyplot as plt
[2]:
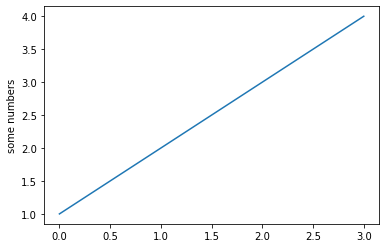
#
# Especificación únicamente de `y`
#
plt.plot([1, 2, 3, 4])
plt.ylabel("some numbers")
plt.show()
[3]:
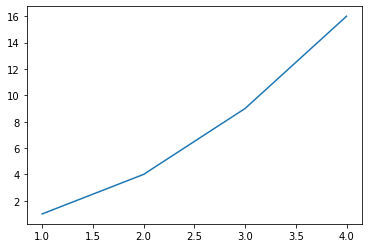
#
# Especificación de `x` y `y`
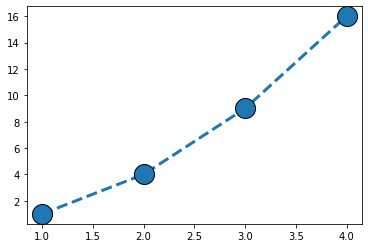
#
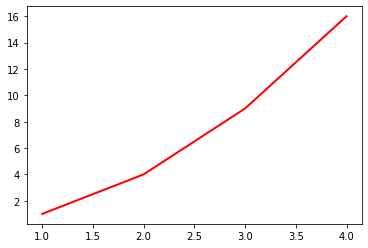
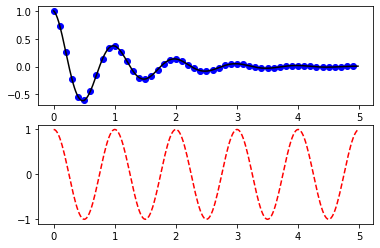
plt.plot(
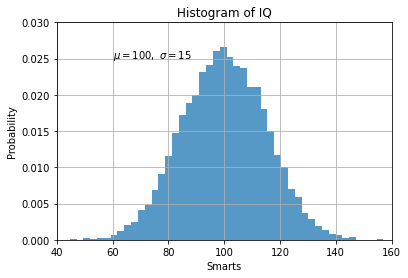
    [1, 2, 3, 4],
    [1, 4, 9, 16],
)
plt.show()
[4]:
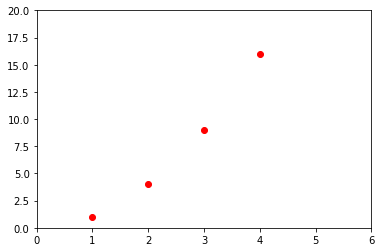
#
# Especificación del estilo
#
plt.plot(
    [1, 2, 3, 4],
    [1, 4, 9, 16],
    "ro",
)
plt.axis([0, 6, 0, 20])
plt.show()
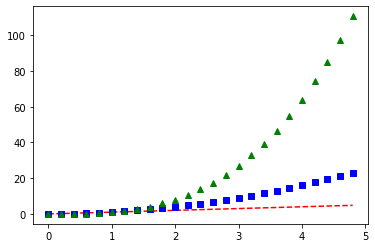
[5]:
#
# Especificación del estilo
#
import numpy as np

t = np.arange(0.0, 5.0, 0.2)

plt.plot(
    # --------- Primera línea ---------
    t,
    t,
    "r--",
    # --------- Segunda línea ---------
    t,
    t ** 2,
    "bs",
    # --------- Tercera línea ---------
    t,
    t ** 3,
    "g^",
)
plt.show()
[6]:
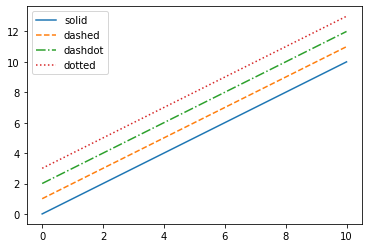
#
# Estilos de línea
#
x = np.linspace(0, 10, 10)

linestyles = ["solid", "dashed", "dashdot", "dotted"]

for i_style, style in enumerate(linestyles):
    plt.plot(x, x + i_style, linestyle=style, label=style)

plt.legend()
plt.show()
[7]:
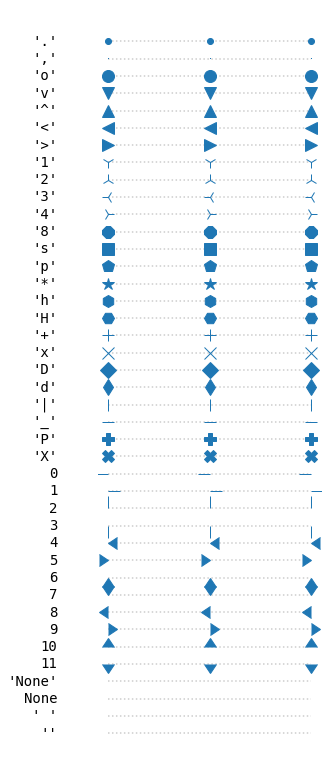
#
# Estilos de marcador
#
from matplotlib.lines import Line2D

plt.figure(figsize=(4, 14))

markers = [m for m, func in Line2D.markers.items()]

text_style = dict(
    horizontalalignment="right",
    verticalalignment="center",
    fontsize=14,
    fontfamily="monospace",
)

marker_style = dict(
    linestyle=":",
    color="0.8",
    markersize=12,
    markerfacecolor="tab:blue",
    markeredgecolor="tab:blue",
)

for y, marker in enumerate(markers):

    plt.text(-0.5, y, repr(marker), **text_style)
    plt.plot([y] * 3, marker=marker, **marker_style)
    # plt.gca().margins(0.2)
    plt.gca().set_axis_off()
    plt.gca().invert_yaxis()

plt.show()
[8]:
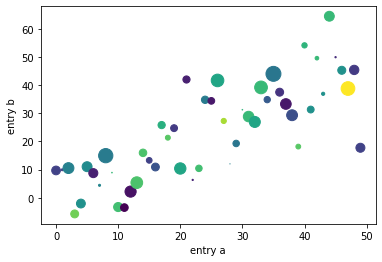
#
# Uso de palabras reservadas
#
data = {
    "a": np.arange(50),
    "c": np.random.randint(0, 50, 50),
    "d": np.random.randn(50),
}

data["b"] = data["a"] + 10 * np.random.randn(50)

data["d"] = np.abs(data["d"]) * 100

plt.scatter(
    "a",
    "b",
    c="c",
    s="d",
    data=data,
)

plt.xlabel("entry a")
plt.ylabel("entry b")

plt.show()
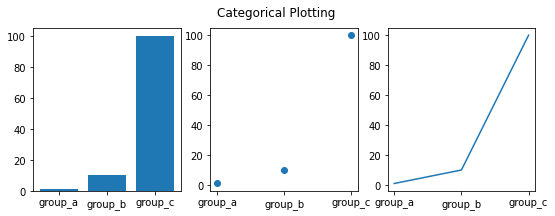
[9]:
#
# Gráficos con variables categóricas
#
names = ["group_a", "group_b", "group_c"]
values = [1, 10, 100]

plt.figure(figsize=(9, 3))

plt.subplot(131)
plt.bar(names, values)

plt.subplot(132)
plt.scatter(names, values)

plt.subplot(133)
plt.plot(names, values)

plt.suptitle("Categorical Plotting")

plt.show()
[10]:
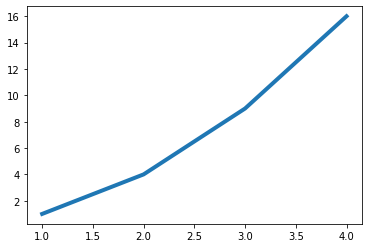
#
# Control de las propiedades de las líneas usando argumentos
# de la función
#
x = [1, 2, 3, 4]
y = [1, 4, 9, 16]
plt.plot(x, y, linewidth=4.0)
plt.show()
[11]:
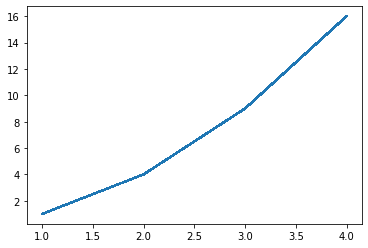
#
# Control de las propiedades de las líneas usando
# setter methods
#
x = [1, 2, 3, 4]
y = [1, 4, 9, 16]
(line,) = plt.plot(x, y, "-")
line.set_antialiased(False)
plt.show()
[12]:
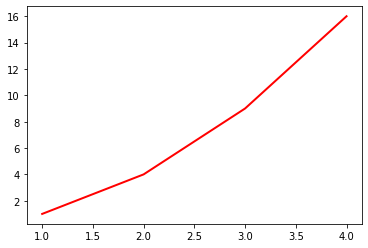
#
# Control de las propiedades de las líneas usando
# setp con keyword args
#
x = [1, 2, 3, 4]
y = [1, 4, 9, 16]
lines = plt.plot(x, y)
plt.setp(lines, color="r", linewidth=2.0)
plt.show()
[13]:
#
# Control de las propiedades de las líneas usando
# setp con parejas string value (Matlab style)
#
x = [1, 2, 3, 4]
y = [1, 4, 9, 16]
lines = plt.plot(x, y)
plt.setp(lines, "color", "r", "linewidth", 2.0)
plt.show()
Propiedad                 Tipo de valor
--------------------------------------------------------------------
alpha                     float
color / c                 any matplotlib color
linestyle / ls            [ '-' | '--' | '-.' | ':' | 'steps' | ...]
linewidth / lw            float
marker                    ['+' | ',' | '.' | '1' | '2' | '3' | '4' ]
markeredgecolor or mec    any matplotlib color
markerfacecolor or mfc    any matplotlib color
markersize or ms          float
zorder                    any number
[14]:
x = [1, 2, 3, 4]
y = [1, 4, 9, 16]
plt.plot(
    x,
    y,
    linestyle="--",
    lw=3,
    marker="o",
    markeredgecolor="k",
    ms=20,
)
plt.show()
[15]:
#
# Varias figuras y ejes
#


def f(t):
    return np.exp(-t) * np.cos(2 * np.pi * t)


t1 = np.arange(0.0, 5.0, 0.1)
t2 = np.arange(0.0, 5.0, 0.02)

plt.figure()

plt.subplot(211)
plt.plot(t1, f(t1), "bo", t2, f(t2), "k")

plt.subplot(212)
plt.plot(t2, np.cos(2 * np.pi * t2), "r--")

plt.show()
[16]:
#
# Texto
#
mu, sigma = 100, 15
x = mu + sigma * np.random.randn(10000)

n, bins, patches = plt.hist(x, 50, density=1, facecolor="tab:blue", alpha=0.75)

plt.xlabel("Smarts")
plt.ylabel("Probability")

plt.title("Histogram of IQ")

plt.text(60, 0.025, r"$\mu=100,\ \sigma=15$")

plt.axis([40, 160, 0, 0.03])

plt.grid(True)

plt.show()
[17]:
#
# Anotaciones
#
ax = plt.subplot()

t = np.arange(0.0, 5.0, 0.01)
s = np.cos(2 * np.pi * t)

plt.plot(t, s, lw=2)
plt.annotate(
    "local max",
    xy=(2, 1),
    xytext=(3, 1.5),
    arrowprops=dict(facecolor="black", shrink=0.05),
)

plt.ylim(-2, 2)
plt.show()
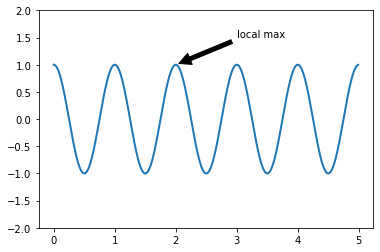
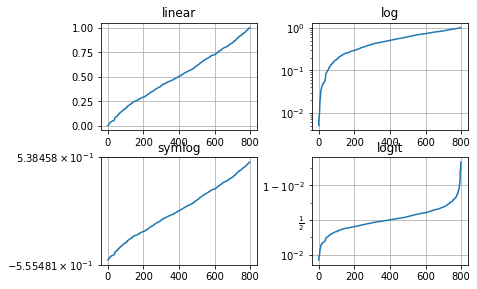
[18]:
import warnings

warnings.filterwarnings("ignore")
#
# Tipos de ejes
#
np.random.seed(19680801)


y = np.random.normal(loc=0.5, scale=0.4, size=1000)
y = y[(y > 0) & (y < 1)]
y.sort()
x = np.arange(len(y))


plt.figure()

#
# linear
#
plt.subplot(221)
plt.plot(x, y)
plt.yscale("linear")
plt.title("linear")
plt.grid(True)

#
# log
#
plt.subplot(222)
plt.plot(x, y)
plt.yscale("log")
plt.title("log")
plt.grid(True)

#
# symmetric log
#
plt.subplot(223)
plt.plot(x, y - y.mean())
plt.yscale("symlog", linthresh=0.01)
plt.title("symlog")
plt.grid(True)

#
# logit
#
plt.subplot(224)
plt.plot(x, y)
plt.yscale("logit")
plt.title("logit")
plt.grid(True)


plt.subplots_adjust(
    top=0.92, bottom=0.08, left=0.10, right=0.95, hspace=0.25, wspace=0.35
)

plt.show()
