Series de tiempo en Matplotlib — 5:15 min
5:15 min | Última modificación: Octubre 6, 2021 | YouTube
En este tutorial se aborda el tema de visualización de series de tiempo.
[1]:
import matplotlib.pyplot as plt
import pandas as pd

df = pd.read_csv(
    "https://raw.githubusercontent.com/jdvelasq/datalabs/master/datasets/sutter.csv",
)

display(df.head(), df.dtypes)
| time | value | |
|---|---|---|
| 0 | 1946-01-01 | 890 |
| 1 | 1946-02-01 | 992 |
| 2 | 1946-03-01 | 979 |
| 3 | 1946-04-01 | 959 |
| 4 | 1946-05-01 | 1110 |
time     object
value     int64
dtype: object
[2]:
#
# Convierte la columna time a un objeto datetime
#
df.time = pd.to_datetime(df.time, errors='coerce')

#
# Convierte la columna time en el indice de las
# filas
#
df = df.set_index('time')

display(
    df.head(),
    df.dtypes
)
| value | |
|---|---|
| time | |
| 1946-01-01 | 890 |
| 1946-02-01 | 992 |
| 1946-03-01 | 979 |
| 1946-04-01 | 959 |
| 1946-05-01 | 1110 |
value    int64
dtype: object
[3]:
#
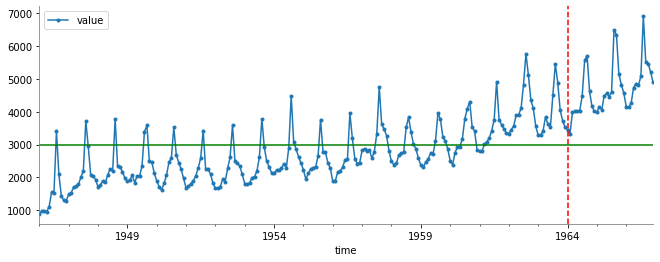
# Gráfica de la serie de tiempo usando Matplotlib
#
_ = df.plot(
    color='tab:blue',
    figsize=(11,4),
    marker='.',
)

#
# Línea vertical
#
plt.axvline(
    '1964-01-01',
    color='red',
    linestyle='--',
)

#
# Línea horizontal
#
plt.axhline(
    3000,
    color='green',
)


plt.gca().spines["left"].set_color("gray")
plt.gca().spines["bottom"].set_color("gray")
plt.gca().spines["top"].set_visible(False)
plt.gca().spines["right"].set_visible(False)

[4]:
#
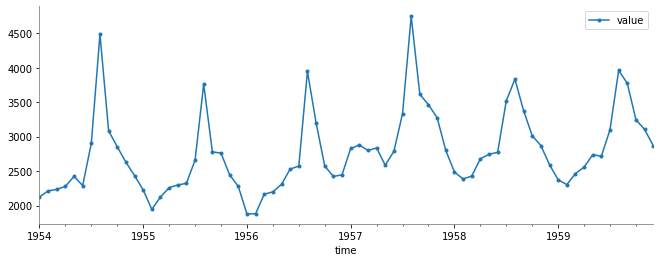
# Visualización de un rango de tiempo
#
df_subset = df['1954-01-01':'1959-12-01']

_ = df_subset.plot(
    color='tab:blue',
    figsize=(11,4),
    marker='.',
)

plt.gca().spines["left"].set_color("gray")
plt.gca().spines["bottom"].set_color("gray")
plt.gca().spines["top"].set_visible(False)
plt.gca().spines["right"].set_visible(False)

[5]:
#
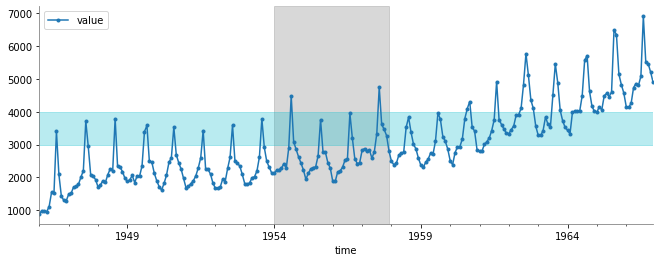
# Regiones de interes
#
_ = df.plot(
    color='tab:blue',
    figsize=(11,4),
    marker='.',
)

plt.axvspan(
    '1954-01-01',
    '1957-12-01',
    color='tab:gray',
    alpha=0.3,
)


plt.axhspan(
    3000,
    4000,
    color='tab:cyan',
    alpha=0.3,
)

plt.gca().spines["left"].set_color("gray")
plt.gca().spines["bottom"].set_color("gray")
plt.gca().spines["top"].set_visible(False)
plt.gca().spines["right"].set_visible(False)
