Análisis de datos usando Pandas — 11:16 min
11:16 min | Última modificación: Octubre 6, 2021
Una de los principales usos de Pandas es el análisis de datos organizados en tablas. En este análisis se incluye el cómputo de KPIs y la agregación, filtrado y graficación de datos.
Al finalizar el documento, usted estará en capacidad:
Cargar datos almacenados en archivos CSV disponibles en un repo en GitHub.
Computar variables a partir de los datos en un dataframe.
Filtrar registros.
Determinar si hay valores nulos en una columna y transformarlos.
Generar columnas calculadas.
Agregar datos usndo groupby.
Graficar agregaciones.
Este ejemplo está basado en el tutorial de Spark de HortoWorks, disponible en https://es.hortonworks.com/tutorial/learning-spark-sql-with-zeppelin/
Descripción de los campos del archivo
El archivo usado contiene la información sobre vuelos entre 1987 y 2008, y cuenta con los siguientes campos:
Year: 1987-2008
Month: 1-12
DayofMonth: 1-31
DayOfWeek: 1 (Monday) - 7 (Sunday)
DepTime: actual departure time (local, hhmm)
CRSDepTime: scheduled departure time (local, hhmm)
ArrTime: actual arrival time (local, hhmm)
CRSArrTime: scheduled arrival time (local, hhmm)
UniqueCarrier: unique carrier code
FlightNum: flight number
TailNum: plane tail number
ActualElapsedTime: in minutes
CRSElapsedTime: in minutes
AirTime: in minutes
ArrDelay: arrival delay, in minutes
DepDelay: departure delay, in minutes
Origin: origin IATA airport code
Dest: destination IATA airport code
Distance: in miles
TaxiIn: taxi in time, in minutes
TaxiOut: taxi out time in minutes
Cancelled: was the flight cancelled?
CancellationCode: reason for cancellation (A = carrier, B = weather, C = NAS, D = security)
Diverted: 1 = yes, 0 = no
CarrierDelay: in minutes
WeatherDelay: in minutes
NASDelay: in minutes
SecurityDelay: in minutes
LateAircraftDelay: in minutes
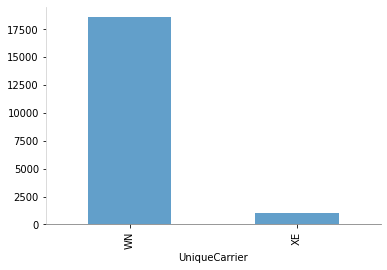
Se desea analizar la cantidad de vuelos retrasados por transportador.
Preparación
[1]:
import matplotlib.pyplot as plt
import numpy as np

import pandas as pd

pd.set_option("display.notebook_repr_html", False)
Carga de datos
[2]:
flights = pd.read_csv(
    "https://raw.githubusercontent.com/jdvelasq/playground/master/datasets/flights.csv",
    sep=",",
    thousands=None,
    decimal=".",
)

flights.info()
<class 'pandas.core.frame.DataFrame'>
RangeIndex: 99999 entries, 0 to 99998
Data columns (total 29 columns):
 #   Column             Non-Null Count  Dtype
---  ------             --------------  -----
 0   Year               99999 non-null  int64
 1   Month              99999 non-null  int64
 2   DayofMonth         99999 non-null  int64
 3   DayOfWeek          99999 non-null  int64
 4   DepTime            98857 non-null  float64
 5   CRSDepTime         99999 non-null  int64
 6   ArrTime            98697 non-null  float64
 7   CRSArrTime         99999 non-null  int64
 8   UniqueCarrier      99999 non-null  object
 9   FlightNum          99999 non-null  int64
 10  TailNum            98857 non-null  object
 11  ActualElapsedTime  98697 non-null  float64
 12  CRSElapsedTime     99999 non-null  int64
 13  AirTime            98697 non-null  float64
 14  ArrDelay           98697 non-null  float64
 15  DepDelay           98857 non-null  float64
 16  Origin             99999 non-null  object
 17  Dest               99999 non-null  object
 18  Distance           99999 non-null  int64
 19  TaxiIn             98697 non-null  float64
 20  TaxiOut            98857 non-null  float64
 21  Cancelled          99999 non-null  int64
 22  CancellationCode   1142 non-null   object
 23  Diverted           99999 non-null  int64
 24  CarrierDelay       19629 non-null  float64
 25  WeatherDelay       19629 non-null  float64
 26  NASDelay           19629 non-null  float64
 27  SecurityDelay      19629 non-null  float64
 28  LateAircraftDelay  19629 non-null  float64
dtypes: float64(13), int64(11), object(5)
memory usage: 22.1+ MB
Estadísticos de las columnas numéricas
[3]:
flights.describe()
[3]:
          Year    Month    DayofMonth     DayOfWeek       DepTime  \
count  99999.0  99999.0  99999.000000  99999.000000  98857.000000
mean    2008.0      1.0     17.087741      3.890059   1355.194827
std        0.0      0.0      8.356321      1.953000    464.088277
min     2008.0      1.0      1.000000      1.000000      1.000000
25%     2008.0      1.0     10.000000      2.000000    942.000000
50%     2008.0      1.0     17.000000      4.000000   1344.000000
75%     2008.0      1.0     24.000000      5.000000   1743.000000
max     2008.0      1.0     31.000000      7.000000   2359.000000

         CRSDepTime       ArrTime    CRSArrTime     FlightNum  \
count  99999.000000  98697.000000  99999.000000  99999.000000
mean    1341.983470   1492.730964   1502.593996   1510.586886
std      451.355345    496.372525    478.096654   1185.974280
min      600.000000      1.000000      5.000000      1.000000
25%      940.000000   1114.000000   1120.000000    502.000000
50%     1335.000000   1518.000000   1520.000000   1320.000000
75%     1730.000000   1913.000000   1910.000000   2362.000000
max     2235.000000   2400.000000   2355.000000   7676.000000

       ActualElapsedTime  ...      Distance       TaxiIn       TaxiOut  \
count       98697.000000  ...  99999.000000  98697.00000  98857.000000
mean          107.558072  ...    630.583966      4.76896     10.927461
std            55.351086  ...    437.358628      2.98365      5.988846
min            25.000000  ...     66.000000      1.00000      1.000000
25%            68.000000  ...    324.000000      3.00000      8.000000
50%            88.000000  ...    453.000000      4.00000      9.000000
75%           135.000000  ...    843.000000      5.00000     12.000000
max           382.000000  ...   2363.000000    213.00000    150.000000

          Cancelled      Diverted  CarrierDelay  WeatherDelay      NASDelay  \
count  99999.000000  99999.000000  19629.000000  19629.000000  19629.000000
mean       0.011420      0.001600      9.573488      2.036120      8.353151
std        0.106254      0.039968     21.836836     13.815868     18.826087
min        0.000000      0.000000      0.000000      0.000000      0.000000
25%        0.000000      0.000000      0.000000      0.000000      0.000000
50%        0.000000      0.000000      1.000000      0.000000      0.000000
75%        0.000000      0.000000     11.000000      0.000000     10.000000
max        1.000000      1.000000    431.000000    267.000000    366.000000

       SecurityDelay  LateAircraftDelay
count   19629.000000       19629.000000
mean        0.110805          29.343675
std         1.724888          39.753529
min         0.000000           0.000000
25%         0.000000           1.000000
50%         0.000000          18.000000
75%         0.000000          37.000000
max        88.000000         434.000000

[8 rows x 24 columns]
Visualización de un subconjunto de columnas
[4]:
flights[
    [
        "UniqueCarrier",
        "FlightNum",
        "DepDelay",
        "ArrDelay",
        "Distance",
    ]
].head()
[4]:
  UniqueCarrier  FlightNum  DepDelay  ArrDelay  Distance
0            WN        335       8.0     -14.0       810
1            WN       3231      19.0       2.0       810
2            WN        448       8.0      14.0       515
3            WN       1746      -4.0      -6.0       515
4            WN       3920      34.0      34.0       515
Cómputo del total de registros de la tabla
[5]:
numTotalFlights = len(flights)
numTotalFlights
[5]:
99999
Filtrado de registros para vuelos retrasados
[6]:
#
# Un vuelo con un retrazo mayor a 15 minutos se considera retrasado
# (columna DepDelay).
#
delayedFlights = flights[flights["DepDelay"] > 15][["UniqueCarrier", "DepDelay"]]
delayedFlights.head(5)
[6]:
   UniqueCarrier  DepDelay
1             WN      19.0
4             WN      34.0
5             WN      25.0
6             WN      67.0
11            WN      94.0
Cálculo del porcentaje de vuelos retrasados
[7]:
numDelayedFlights = len(delayedFlights)
print(
    "Porcentaje de vuelos retrasados: "
    + str(round(numDelayedFlights / numTotalFlights * 100, 2))
    + "%"
)
Porcentaje de vuelos retrasados: 19.59%
Copia de una tabla y copia de columnas
[8]:
flightsWithDelays = flights[
    [
        "Year",
        "Month",
        "DayofMonth",
        "UniqueCarrier",
        "FlightNum",
        "DepDelay",
    ]
].copy()

#
# Crea una nueva columna como copia de una existente.
#
flightsWithDelays["IsDelayed"] = flightsWithDelays["DepDelay"].copy()
Conteo de registros nulos en una columna
[9]:
flightsWithDelays.IsDelayed.isna().sum()
[9]:
1142
Aplicación de una función a una columna
[10]:
flightsWithDelays["IsDelayed"] = flightsWithDelays["IsDelayed"].map(
    lambda x: 0 if np.isnan(x) else x
)

flightsWithDelays["IsDelayed"] = flightsWithDelays["IsDelayed"].map(
    lambda x: 1 if x > 15 else 0
)

flightsWithDelays[["DepDelay", "IsDelayed"]].head(10)
[10]:
   DepDelay  IsDelayed
0       8.0          0
1      19.0          1
2       8.0          0
3      -4.0          0
4      34.0          1
5      25.0          1
6      67.0          1
7      -1.0          0
8       2.0          0
9       0.0          0
Cálculo del porcentaje de vuelos retrasados
[11]:
print(
    "Porcentaje de vuelos retrasados: {:4.2f} %".format(
        100 * flightsWithDelays.IsDelayed.sum() / flightsWithDelays.DepDelay.count()
    )
)
Porcentaje de vuelos retrasados: 19.81 %
Cantidad de vuelos retrasados por transportador
[12]:
flights["IsDelayed"] = flights["DepDelay"].copy()

flights["IsDelayed"] = flights["IsDelayed"].map(lambda x: 0 if np.isnan(x) else x)

flights["IsDelayed"] = flights["IsDelayed"].map(lambda x: int(x > 15))

(flights.groupby("UniqueCarrier").sum())["IsDelayed"].plot.bar(
    color="tab:blue",
    alpha=0.7,
)

plt.gca().spines["left"].set_color("lightgray")
plt.gca().spines["bottom"].set_color("gray")
plt.gca().spines["top"].set_visible(False)
plt.gca().spines["right"].set_visible(False)

plt.show()

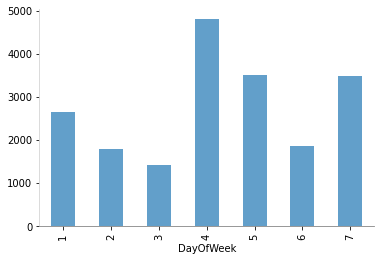
Retrasos por día de la semana
[13]:
(flights.groupby("DayOfWeek").sum())["IsDelayed"].plot.bar(
    color="tab:blue",
    alpha=0.7,
)

plt.gca().spines["left"].set_color("lightgray")
plt.gca().spines["bottom"].set_color("gray")
plt.gca().spines["top"].set_visible(False)
plt.gca().spines["right"].set_visible(False)

plt.show()

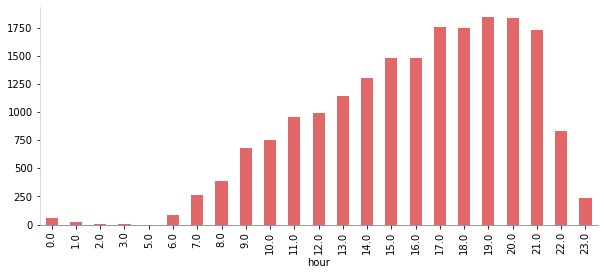
Retrasos por hora del día
[14]:
flights["hour"] = flights["DepTime"].copy()

flights["hour"] = flights["hour"].map(lambda x: int(x / 100) if not np.isnan(x) else x)

(flights.groupby("hour").sum())["IsDelayed"].plot.bar(
    color="tab:red",
    alpha=0.7,
    figsize=(10, 4),
)

plt.gca().spines["left"].set_color("lightgray")
plt.gca().spines["bottom"].set_color("gray")
plt.gca().spines["top"].set_visible(False)
plt.gca().spines["right"].set_visible(False)

plt.show()
